How We Use Data-Driven Decisions — Part 2: Helping Companies Diversify Their Business
How We Use Data-Driven Decisions — Part 2: Helping Companies Diversify Their Business
In this post, I will continue sharing IndexBox’s insights on how to use big data to make informed business development decisions. Previously, we talked about sourcing new market opportunities to boost a company’s exports, and the AI platform which makes this happen. The next question the platform can answer is how to find the best product or industry to diversify your business.
There are at least three occasions when this issue arises:
— When companies want to expand their business by launching new products which have the best market potential.
— When producers, suffering from low demand on their traditional markets, need new products to load idle production capacities.
— When investors want to be sure that their projects have higher market prospects than other alternatives.
Our AI platform can answer this question, like many other, using its own algorithm. It was primarily developed by our in-house analysts and was powered by machine learning principles. This approach is suitable for both manufactured goods and agricultural products, and it works either for a single country or for a global marketplace.
Before we dive into the guide, let me introduce you to the new hero of this post. Our hero is a producer of soybeans who sells his products on the local and overseas markets. Now he is searching for new profitable products, among other crops, to expand his business. Our approach will help him to make an informed decision on this issue.
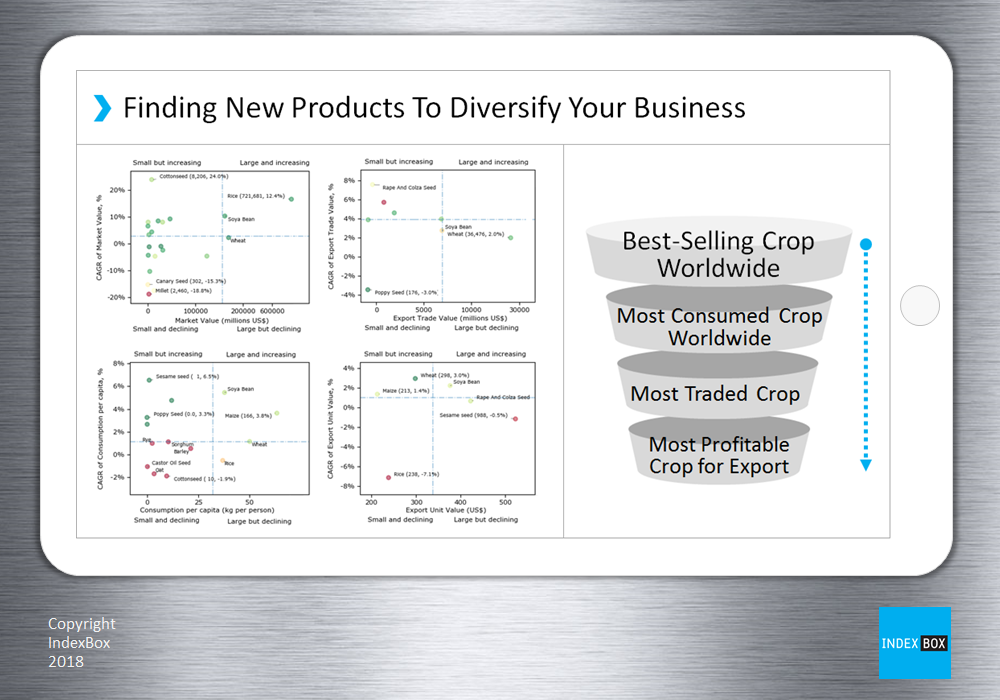
#1 Best-Selling Crops Worldwide
The first question we will help a soybean producer answer is: Which crops performed best in terms of sales in the last 5 years? And which products were among the outsiders?
To do that, we will build our own map. Let’s take a square and divide it into four parts. On the right-hand side, we will mark the crops with the biggest sales — these are the largest markets. On the left, we will input the small markets. We will put the crops, where sales have been growing for the last 5 years, at the top of the graph. At the bottom of the graph, meanwhile, we will input products where sales have been declining or showing very little growth.
Now let’s gather the necessary information here and put the products in the relevant quadrants.
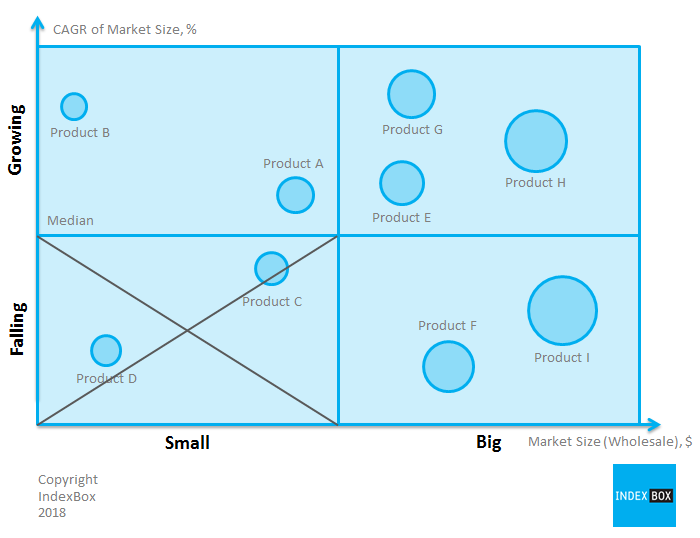
In the lower left quadrant, we can see crop varieties with small markets, where sales are falling. These products are not appealing to our producer, so let’s cross them out and omit them from any further consideration. The remainder of the products showed a relatively good result.
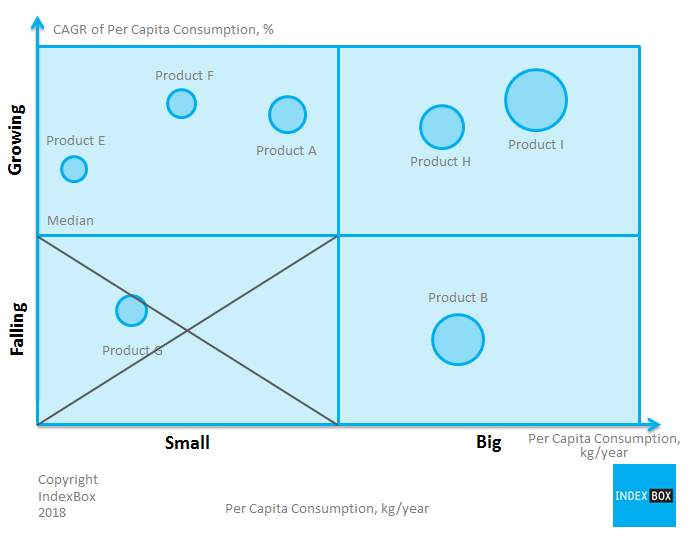
#2 Most Consumed Crops Worldwide
At this stage, we will answer the following question: which crop varieties are the most promising, in terms of consumption growth, and which ones are already saturated?
To answer this question, we will be using information on per capita consumption. In other words: how much of a certain crop does one person consume on a yearly basis?
It may emerge that product sales in the lower-hand left quadrant are rising because of the price increases, but declining in physical terms. These markets are saturated and not sustainable in the long run, that’s why we have opted to exclude them from any further consideration.
We will source this data here.
#3 Most Traded Crops
As our hero wants to benefit from selling goods on overseas markets, we will analyze new products in terms of their export prospects.
In order to achieve this, we will draw a new map. We’ll simply take a square and divide it into 4 parts. On the right, we will mark the crop variety where a large volume of exports is observed. To the left — those crops where export levels are low. At the top, we will mark products with an increasing volume of trade. Below — where trade is falling or showing little growth.
Let’s source the necessary data here and place the remaining products in the square, in accordance with the export volume and rates of growth.
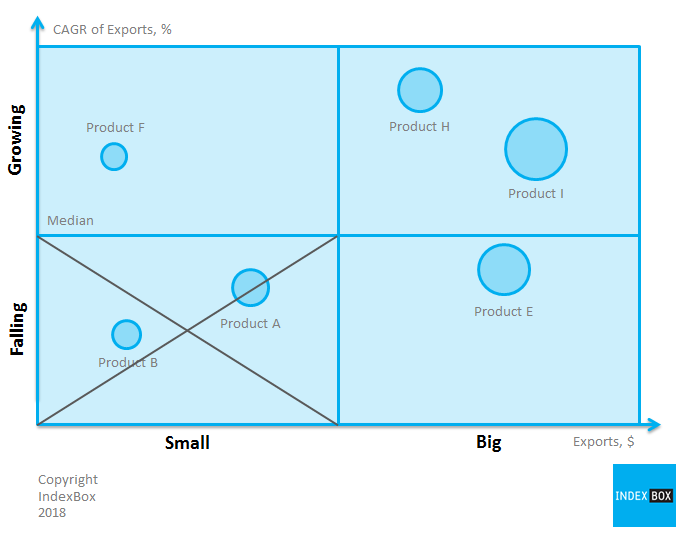
As you might guess, the lower left-hand quadrant features crop varieties with a low volume of exports and a negative dynamic. These products do not boast any development potential for exporters. We will exclude these countries from our analysis and move on to the next stage.
#4 Most Profitable Crops for Export
In the last 4th stage of our analysis, we will answer the following question: Which crop varieties are the most profitable for producers?
Once again, we will draw a new map, take a square and divide it into 4 parts. On the right, let’s mark the varieties where we observe the highest price of exported crops. On the left are the products with the lowest prices. In the upper half, we mark the varieties where the prices of exported crops have grown in the last 5 years. In the lower half, we’ll input products where they fell.
Take the necessary data here, and place the products in the corresponding quadrants.
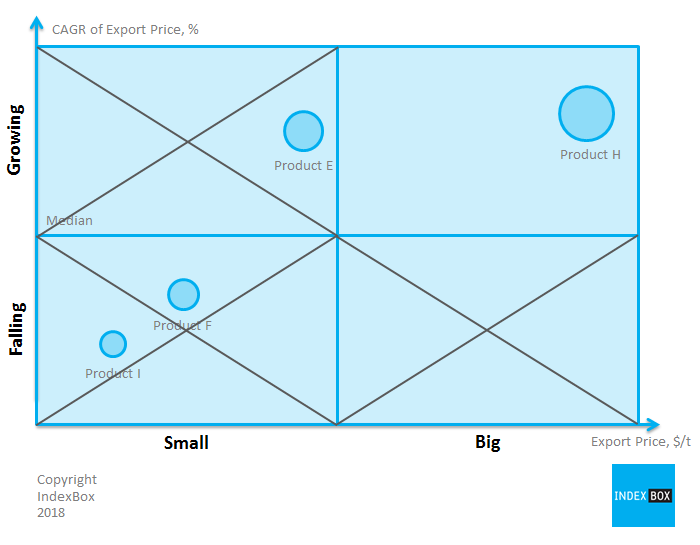
It is easy to see that the crop varieties with the highest and increasing export prices are in the right upper quadrant. For our producer, these are the most profitable products.
Summary
After applying the given filters, we now have a list of the most promising products to diversify our hero’s business. These products may well become a strategic alternative for those who are seeing a gradual decline in demand for their products, or for those who want to expand their product matrix. Dozens of our clients managed to use this methodology and received impressive results.
What do you think?
Leave comments below and subscribe to find out more insights about how our AI-powered platform can help to grow your business.